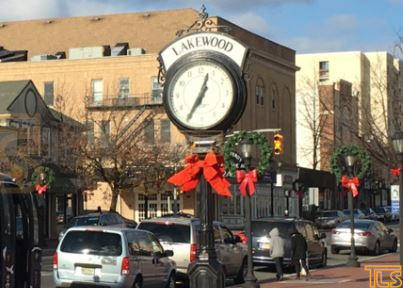
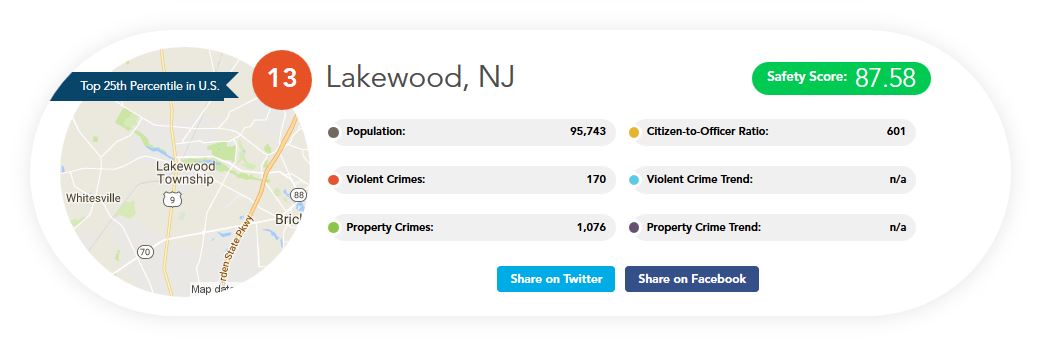
 The Township of Lakewood made it to SafeHome’s 2017 list of the Safest Cities in the US and ranked No. 13 in NJ.
Furthermore, Township of Lakewood made the list of the Top 101 safest cities in the United States and was in the 25th Percentile.
Background on the study – from Safe Home: “There have been similar studies in the past, however we went further and used a variety of data sources and combination of the FBI’s latest report on how many and what types of crimes occurred, crime trends and other data points like law enforcement officer ratio, demographics, population density, unemployment rate, income, education level etc. to come up with our scoring.” (Methodology below.)

METHODOLOGY:
Safest Cities: The Methodology
Overview
This ranking calculates a Safety Score for major cities in the US. The higher the Safety Score, the safer data shows the city to be.
We look at several different factors when assigning a Safety Score to a city. First and foremost is the FBI’s latest report of how many and what types of crimes occurred in each city over a single year. The city’s crime trends are also considered; in other words, cities where crime is on the decline are given a higher Safety Score and vice-versa. We also look at the number of law enforcement officers compared to the population.
Finally, demographic metrics that are correlated to crime have a small impact on Safety Score. These include metrics such as population density, population trends, unemployment rate, median income, education level, etc.
About the Data
FBI Data
The FBI’s UCR (Uniform Crime Reporting) program has existed since the 1920s, and is the most comprehensive source of crime statistics. Every year, data on crime occurrences is collected from the nation’s law enforcement agencies. Data is not included if a given city’s law enforcement agency does not follow UCR’s reporting guidelines.
Crime is reported in two categories, violent crime and property crime. Violent crime includes murder and nonnegligent manslaughter, rape, robbery, and aggravated assault. Property crime includes burglary, larceny-theft, motor vehicle theft, and arson. (Arson data is limited, therefore is not included in our Safety Score).
Crimes are reported both as raw numbers and as occurrences per 100,000 residents. The occurrences per 100,000 residents are used in our analysis. This is because a large city such as New York City will have more crime occurrences simply because it has such a large population. The process of dividing per 100,000 residents allows for fairer comparison among cities of different sizes.
The FBI UCR data also includes, for many cities, a count of total law enforcement employees, both officers and civilians.
The most recent data available from FBI UCR is for calendar year 2015. We have compared to each city’s 2014 data to analyze whether violent crime and property crime are rising or declining.
Census Data
Demographic data is available from the US Census, last conducted in 2010. This data is more readily available by MSA (Metropolitan Statistical Area) than by city. For example, New York City itself is considered a city, while the New York City Metropolitan Statistical Area encompasses additional cities such as Newark, New Jersey and Jersey City, New Jersey.
Where possible, each city in the rankings was matched to its appropriate MSA.
Calculating the Safety Score
Preparing the Data
The FBI UCR statistics are available online for public download. We obtained a copy of the 2015 data. Cities without 2015 data, due to incomplete data or not following UCR’s guidelines, are not given a Safety Score.
For the national rankings, cities with a population under 50,000 are not considered. This results in a digestible national list of safe cities and reduces the risk of outlier statistics.
Next, the 2015 data is combined with other datasets. The 2014 UCR crime statistics and the 2015 number of full time law enforcement are also provided by the FBI. If 2014 data or law enforcement data are missing, those cities are given a neutral, or average, value for these factors rather than being removed from the ranking. Neutral values are also given for crime trends in some cases where a city’s reporting statistics changed, and 2014 data cannot be fairly compared to 2015 data.
Demographic data comes from the US Census and is presented by Metropolitan Statistical Area. Each city must be matched to its associated MSA. In some cases, a city may be associated with an MSA across a state line. For example, Newark, New Jersey is associated with the New York City MSA.
Safety Score Formula
For each city, a crime score is calculated, and the Safety Score is the reciprocal of the crime score. In plain English, the crime score is based on the combination of occurrences (per 100,000) of the seven crimes, the officer-to-population ratio, violent crime trend, property crime trend, and six demographic factors.
However, each of these factors is not given equal consideration. Each factor listed above is given a weight, with a weight of 100% contributing most to the city’s crime score. The formula and table below show how much weight each factor is given.
Crime Score =
X1A1 + X2A2 + X3A3 + X4A4 + X5A5 + X6A6 + X7A7 + …
Y1B1 + Y2B2 + Y3B3 + …
– Z1C1 – Z2C2 + Z3C3 + Z4C4 – Z5C5 – Z6C6
| Variables | Factor | Weight | |
| X1 | A1 | Murder Rate | 100% |
| X2 | A2 | Rape Rate | 86% |
| X3 | A3 | Robbery Rate | 90% |
| X4 | A4 | Assault Rate | 88% |
| X5 | A5 | Burglary Rate | 74% |
| X6 | A6 | Larceny Rate | 80% |
| X7 | A7 | Vehicle Theft Rate | 62% |
| Y1 | B1 | Population : Officer | 50% |
| Y2 | B2 | Violent Crime % Change | 50% |
| Y3 | B3 | Property Crime % Change | 40% |
| Z1 | C1 | Pop Density | 10% |
| Z2 | C2 | % Pop Change | 10% |
| Z3 | C3 | % Youth Population (15-24) | 5% |
| Z4 | C4 | Unemployment | 5% |
| Z5 | C5 | Median Income | 10% |
| Z6 | C6 | Education Level | 5% |
Crime occurrences are treated as the most serious (highly weighted) factors. Weights are between 100% and 60%. Weights are determined by a combination of seriousness (as determined by FBI) and society’s fear (as determined by a large 2016 study by Chapman University). See the Appendix for more details.
Officer to Population ratio and crime trends are given medium weights.
If a city doesn’t report either their 2014 data or their number of law enforcement, that city gets a neutral value for officer to population ratio and crime trends. Neutral values are 0% for crime trend and 435 (the national average) for population-to-officer ratio. This method is intended to avoid removing cities from the dataset for not having these metrics available, while at the same time not giving an unfair advantage or disadvantage on Safety Score. Essentially these cities are scored based on only 2015 data and Census data.
Demographic factors are given low weights. These are weighted low because data is available only at the Metropolitan Statistical Area level and not at the individual city level.
Finally, the crime score is flipped and scaled from 0 to 100. In other words, the city with the highest crime score is assigned a Safety Score of 0 and the lowest crime score is assigned a Safety Score of 100. This makes the Safety Scores more understandable.
State Level Rankings
Some less populous states have only one, or even zero, cities appearing in the national rankings. For the state level rankings, the population threshold was relaxed so that at least 25 cities would be ranked per state. The rest of the methodology is the same as for the national rankings.
Appendix
The following table shows how the seven types of crimes are ranked by seriousness and by fear. The rankings are then “flipped” or transposed so that the most serious gets the highest value. The transposed values are multiplied. Then, this combined score is normalized and fit within 100% to 80% for the violent crimes and 60% to 80% for the property crimes.
| Crime Type | Seriousness | Fear | SeriousnessT | FearT | Combination | Weight |
| murder | 1 | 3 | 7 | 3 | 21 | 100% |
| rape | 2 | 5 | 6 | 1 | 6 | 86% |
| robbery | 3 | 4 | 5 | 2 | 10 | 90% |
| assault | 4 | 4 | 4 | 2 | 8 | 88% |
| burglary | 5 | 2 | 3 | 4 | 12 | 80% |
| larceny | 6 | 1 | 2 | 5 | 10 | 77% |
| vehicle | 7 | 4 | 1 | 2 | 2 | 63% |
I seriously doubt this report.
Also, since when is lkwd a city?
What a joke…they have obviously never driven in Lakewood…..
Shomer yisrael shmor sheiris yisrael…. keep pumping those tefilos
Mom of 2, I was thinking the same thing when I saw the headline
To all the comments: Lakewood is very safe. If you lived anywhere, you would know that you can easily be mugged or stabbed past 10 PM. Lakewood is a town were you can be on the streets at 2 AM and no one will touch you. There are many car accidents but I blame the small streets/car density and bad intersections. These calculations are weighting in murder, assault, and rape. These are not problems in Lakewood.
Thank you Eric